
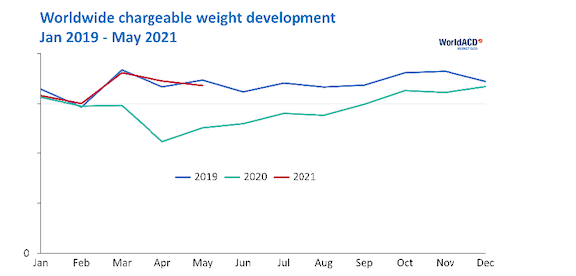
Last month, WorldACD reported a Year-on-Year (YoY) volume increase of 53% for April 2021, largely influenced by the ‘rock-bottom’ month of April 2020 in air cargo. Unsurprisingly, the YoY volume increase for May 2021 is much lower, though still +33%. Overall volume for the first five months of 2021 is 20% above 2020. To put this in perspective, we compared the Year-to-Date (YtD) 2021 with YtD 2019 (Yo2Y). The chart below shows that the worldwide volumes so far in 2021 behave very much like in 2019: YtD May 2021 is only 1% below the level of 2019.
However, when we look at this on a more detailed geographic level, the picture is very different. The table below shows that the origin regions Africa, Europe and Middle East & South Asia are below 2019 volume levels, whilst Asia Pacific, Central & South America and North America are above 2019 levels. In other words, different markets show different performances: it matters where you do business.
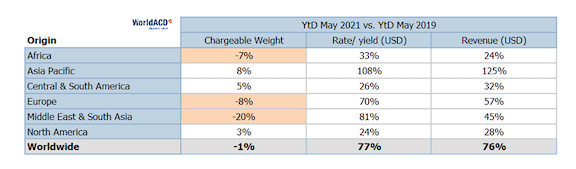
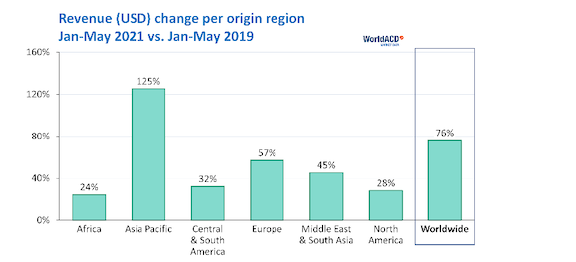
The table above also shows the rate/yield performance. A divergent picture emerges: the Yo2Y increase ranges from +24% from North America to +108% from Asia Pacific. The latter market may receive a lot of attention, but that does not mean it is representative for the industry. Look at the Yo2Y change in USD-revenue, as depicted in the chart below: though all regions have double digit increases compared with 2019, Asia Pacific clearly is in a league of its own.
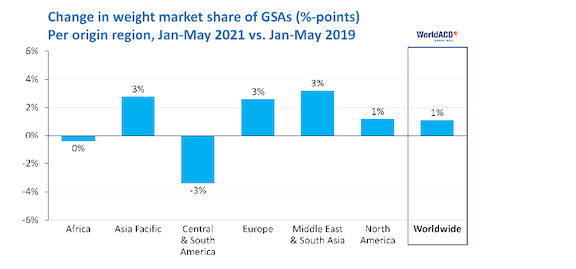
In previous editions of our Trends message, we have reported about the performance of GSAs, and their importance to airlines. Having analysed GSA/airline relationships in detail, we observe that GSAs as a group continue to make inroads, further increasing their worldwide share in air cargo: from 24.2% in 2019 to 25.3% in 2021 (YtD). But, again, it is important to “look under the hood”: the change in market position of GSAs varies from region to region (see the chart below).
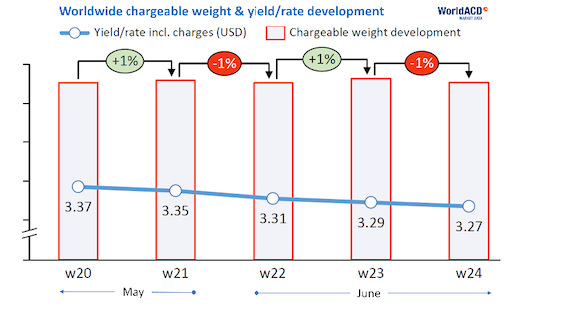
Lastly, heading into the Northern Hemisphere summer, we looked at the provisional June figures derived from our most recent weekly data. The chart below shows the developments of the last five weeks, with the last three weeks (wk 22-24) covering a good part of June. The worldwide average rate has consistently dropped over the last 5 weeks. Volume-wise, June looks slightly lower than May: seasonal pattern or some other influence? We consulted our database to track volume changes from May to June for the past ten years. On average, we saw a decline of 0.4%. In other words, nothing unusual to be found in June 2021 volumes: the month will end up following the 2019 trend we noted for the first five months of the year.
Follow us on social media: