Utility-scale solar has grown rapidly over the past five years
May 04, 2017
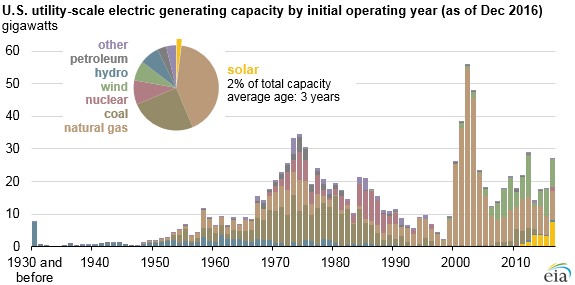
Source: U.S. Energy Information Administration, Preliminary Monthly Electric Generator Inventory
Utility-scale solar installations—including both photovoltaic (PV) and thermal technologies—grew at an average rate of 72% per year between 2010 and 2016, faster than any other generating technologies. Utility-scale solar generation now makes up about 2% of all utility-scale electric generation. The first utility-scale solar plants were installed in the mid-1980s, but more than half of the currently operating utility-scale solar capacity came online in the past two years.
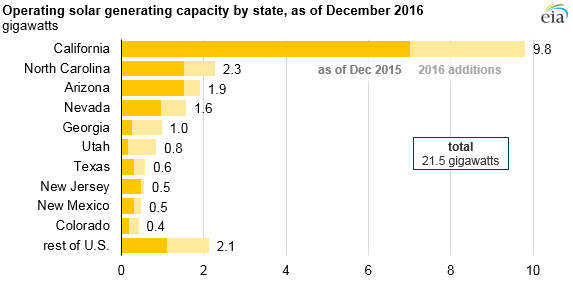
As of December 2016, more than 21.5 gigawatts (GW) of utility-scale solar generating capacity was in operation across the United States, with more than 7.6 GW of that capacity coming online in 2016. Although California has the highest total installed capacity of any state, a number of states have deployed significant utility-scale solar capacity in recent years. Several states have policies such as renewable portfolio standards or state renewable tax credits to encourage solar deployment. Since 2005, the federal government has provided a 30% investment tax credit, which is scheduled to phase down or expire by 2022.
Source: U.S. Energy Information Administration, Preliminary Monthly Electric Generator Inventory
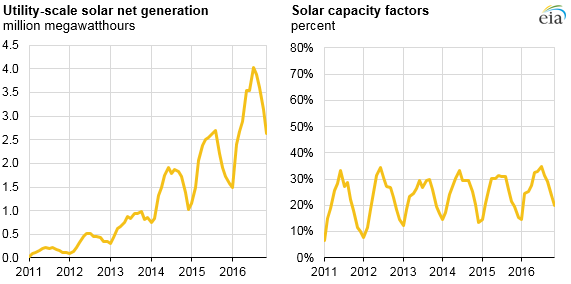
Utility-scale solar generation has been increasing as a result of the rapid growth in capacity; however, solar’s share of utility-scale electricity generation is 0.9%, about half of its share of capacity. Most solar generators are considered an intermittent or non-dispatchable resource because their availability depends on ambient insolation (exposure to the sun). Some systems, such as the Crescent Dunes solar thermal plant, are paired with an energy storage system, which allows greater operational flexibility. As monthly capacity factors indicate, solar generation is strongly seasonal, with more sunlight available in the summer (about 30% capacity factor on average) than in the winter months (near 15%).
graph of wind net generation and wind capacity factors, as explained in the article text
Source: U.S. Energy Information Administration, Electric Power Monthly
In addition to utility-scale solar, electric generating capacity from small-scale solar systems (such as rooftop and other customer-sited PV systems) has also grown. In 2016, EIA estimates that the United States added 3.4 GW of small-scale solar generating capacity across all three end-use sectors (residential, commercial, and industrial), ending the year with more than 13.1 GW of installed capacity. (EIA reports capacity values in GW of alternating current output.)
According to EIA estimates, California, New Jersey, and Massachusetts had the most small-scale solar capacity with 5.4 GW, 1.3 GW, and 1.0 GW, respectively. Monthly generation from small-scale solar capacity is estimated to have been 1.6 million megawatthours (MWh) on average in 2016, or about two-thirds of the amount generated by utility-scale solar generators.
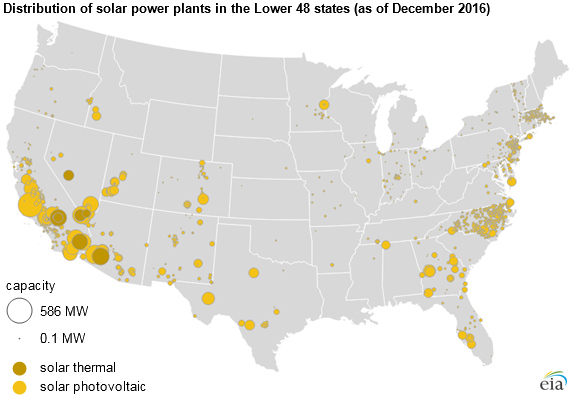
Distribution of solar power plantsSolar generating capacitySource: U.S. Energy Information Administration, Preliminary Monthly Electric Generator Inventory
This article is part of an ongoing series of Today in Energy articles examining the fleet of utility-scale power plants in the United States. Previous articles have examined hydroelectric, coal, natural gas, nuclear, and wind generators.
Principal contributor: Manussawee Sukunta
Whats this about?
It is the “uncontained” shipments that draw a lifetime allegiance of purveyors of the business. As one MPV (Multi Purpose Vessel) analyst bluntly said as an aside, “Boxes are boring.”

Follow us on social media: