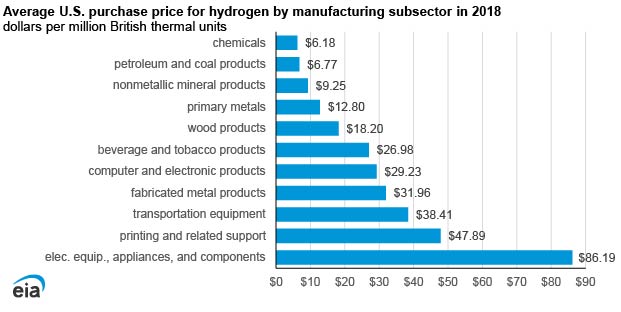
Data source: U.S. Energy Information Administration, Manufacturing Energy Consumption Survey, 2018, Table 7.1
U.S. manufacturers specializing in chemicals and petroleum refining have traditionally accounted for the largest shares of both hydrogen consumption and production, and they pay the least for it. With new legislation, we expect changes to how hydrogen is consumed and distributed in the country.
EIA’s Manufacturing Energy Consumption Survey (MECS) data are collected and published every four years and remain the only nationally representative source of estimates of energy-related characteristics, consumption, and expenditures for manufacturing establishments in the United States. These data are critical to measuring energy intensity and understanding efficiency gains or losses within manufacturing.
We are currently collecting MECS data for 2022, and we expect to publish them beginning in the summer of 2025 through spring 2026.
Refiners, which make up much of the petroleum and coal products subsector under the North American Industry Classification System, and chemicals manufacturers tend to have more buying power than other manufacturing subsectors because they use more hydrogen. On average in 2018, the chemicals subsector paid $6.18 per million British thermal units (MMBtu) for hydrogen, and the petroleum and coal products subsector paid $6.77/MMBtu, according to the MECS data published in 2021. In the MECS, we report the average price of hydrogen purchased by manufacturing establishments for use in their on-site operations.
Within these two industrial subsectors, petroleum refiners used 68% of all U.S. hydrogen production, and nitrogenous fertilizer (ammonia and derivatives) industries used 21%. The large-scale use of hydrogen helps individual manufacturers negotiate low prices in their contracts to secure their hydrogen feedstock requirements. Large industrial hydrogen consumers also frequently have the capacity to either generate their own hydrogen or use hydrogen produced as a byproduct of chemical processes at nearby facilities.
The reported purchase price of hydrogen across all U.S. manufacturing industries in 2018 averaged $6.82/MMBtu, although prices varied widely. Industries that manufacture electrical equipment, appliances, and components, which use hydrogen with a greater purity, paid the highest average price for hydrogen at $86.19/MMBtu.
Based on data from MECS and our Petroleum Supply Annual (PSA), total U.S. production of hydrogen in 2018 was 10 million metric tons, of which 40% was merchant hydrogen sold by industrial gas companies. About two-thirds was sourced from the steam methane reformer (SMR) process, which mainly uses natural gas as a feedstock. The remaining one-third of hydrogen production came as a byproduct of other chemical processes. A small but growing amount of hydrogen is also produced from electrolysis of water—a process that separates water molecules into hydrogen and oxygen.
Newly built merchant plants in the United States using SMR have the lowest levelized cost of hydrogen, which the National Energy Technology Laboratory estimated at $1.06 per kilogram in 2018, or $8.00/MMBtu in 2018 U.S. dollars, including cost of hydrogen compression. The cost does not include the capture of carbon dioxide, which is produced as a byproduct in the SMR process. In the United States, the low cost of natural gas used by the industrial sector in 2018, which we estimate averaged $3.89/MMBtu, drives the relatively low hydrogen production costs from SMR, compared with other production methods.

Data source: EIA map based on U.S. Department of Energy, October 13, 2023, announcement
Note: Pennsylvania is included in both the Appalachian and Mid-Atlantic hydrogen hubs because Pittsburgh is contained in the Appalachian hub and Philadelphia in the Mid-Atlantic hub.


Follow us on social media: