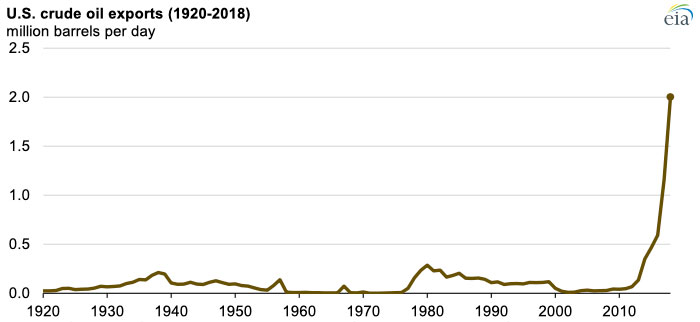
In 2018, U.S. exports of crude oil rose to 2.0 million barrels per day (b/d), nearly double the 1.2 million b/d rate in 2017. Export volumes by destination changed significantly during the year, as U.S. crude oil exports to China fell and exports to other destinations such as South Korea, Taiwan, and Canada increased.

In early 2018, the Louisiana Offshore Oil Port (LOOP) in the Gulf of Mexico was modified to enable the loading of vessels for crude oil exports. LOOP is currently the only U.S. facility capable of accommodating fully loaded Very Large Crude Carriers (VLCC), vessels capable of carrying approximately 2 million barrels of crude oil.
After LOOP was modified to also allow exports, the increase in cargo scale led U.S. crude oil exports to surpass 2 million b/d for 25 weeks in 2018 compared with just 1 week in 2017. In addition to LOOP, other U.S Gulf Coast export facilities in and around Houston and Corpus Christi, Texas, have been investing in increasing the scale of U.S. crude oil export cargos.
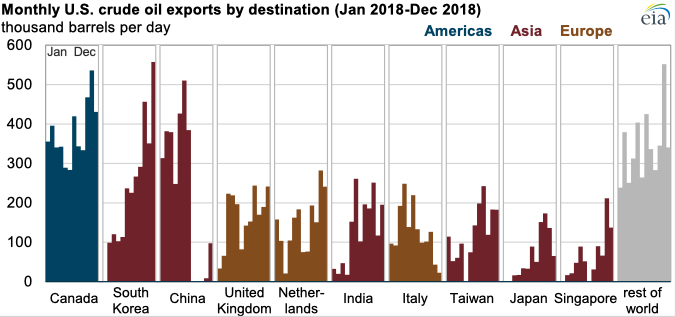
In 2018, Asia was the largest regional destination for U.S. crude oil exports, followed by Europe, while, as in previous years, Canada was the largest single destination for U.S. crude oil exports. Canada received 378,000 b/d of U.S. crude oil exports, representing 19% of total U.S. crude oil exports in 2018. South Korea surpassed China to become the second-largest destination for U.S. crude oil exports in 2018, receiving 236,000 b/d compared with China’s 228,000 b/d.

However, the distribution of U.S. crude oil exports by destination varied significantly from the first half of 2018 to the second half. In the first half of 2018, the United States exported 376,000 b/d of crude oil to China, which made China the largest single destination for U.S. crude oil exports for that period. However, in August, September, and October of 2018, the United States exported no crude oil to China. U.S. crude oil exports to China resumed in the final two months of the year but at much lower volumes. On average, the United States exported 83,000 b/d of crude oil to China in the second half of 2018.
In the summer of 2018, as part of ongoing trade negotiations between the United States and China, China temporarily included U.S. crude oil on a list of goods potentially subject to an increase in import tariffs. Around that time, the difference between the international crude oil benchmark Brent and the U.S. domestic price West Texas Intermediate (WTI) futures prices narrowed: Brent prices went from $9 per barrel (b) higher than WTI in June to $6/b higher than WTI in July.
The rapidly narrowing price discount of U.S. crude oils versus international crude oils and the potential for higher import tariffs caused China’s imports of U.S. crude oil to slow. As U.S. crude oil exports to China fell, exports to South Korea, Taiwan, Canada, and India increased. Ultimately, the rate of crude oil exports to all destinations in the second half of the year (2.2 million b/d) was higher than in the first half (1.8 million b/d).
Principal contributor: Mason Hamilton

Follow us on social media: