EIA's updated report continues a data series that began at the request of Congress in the early 1990s. Most recently, the Secretary of Energy requested updated energy subsidy information as part of the U.S. Department of Energy’s study on grid resiliency.
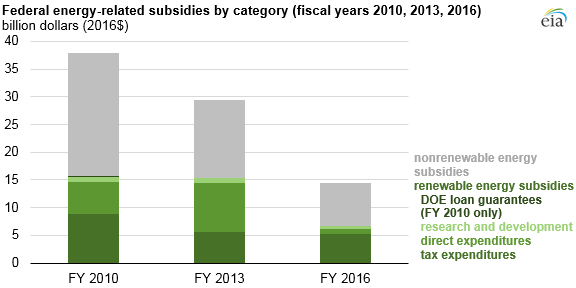
EIA’s recently released Direct Federal Financial Interventions and Subsidies in Energy in Fiscal Year 2016 report provides a detailed analysis of energy subsidies for FY 2010, FY 2013, and FY 2016. This report examines only federal subsidies and financial interventions that are targeted exclusively at energy markets and have an identifiable budget impact.
In the report, EIA defines subsidies as funds a government expends, or revenue it foregoes, to encourage or support certain activities. EIA’s report includes the following financial activities: direct expenditures, tax expenditures, research and development (R&D), and credit subsidies to recipients of federal loan guarantees.

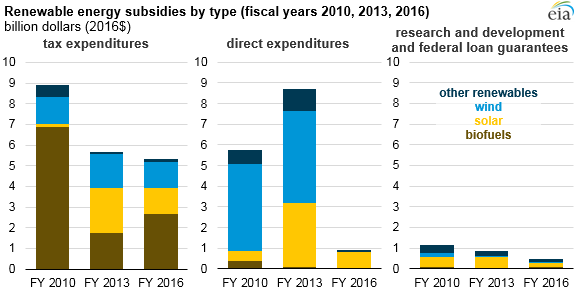
Renewable electricity-related tax expenditures provided nearly 70% of FY 2013 renewable electricity subsidies, falling to about half that share in FY 2016. Most of this amount went to commercial wind and solar installations from the Production Tax Credit (PTC) and the Investment Tax Credit (ITC). The PTC provided an inflation-adjusted tax credit worth 2.4 cents per kilowatthour (kWh) in 2016, while the ITC provided a deduction equal to 30% of facility installation costs. EIA estimates the PTC and ITC credits taken in FY 2016 at $1.4 billion and $1.2 billion, respectively.
Nearly all renewable energy direct expenditures for FY 2010, FY 2013, and FY 2016 resulted from provisions of ARRA. Enacted in 2009, ARRA was a broad-based set of programs designed to expedite economic recovery, including energy infrastructure. Under ARRA, DOE has invested more than $31 billion since 2009. Much of this funding supported renewable energy projects, but by FY 2016, most provisions of ARRA energy programs had expired. Direct expenditures for renewable energy decreased 90%, from nearly $9 billion in FY 2013 to about $1 billion in FY 2016.
Although R&D expenditures are small compared with tax expenditures and direct expenditures, R&D provides the foundation for many energy technology advancements and cost reductions. Federal R&D expenditures for renewable energy were estimated at about $850 million for FY 2010 and FY 2013, but they dropped to about $450 million in FY 2016. Another $296 million in federal loan guarantees was distributed to recipients in FY 2010, but in both FY 2013 and FY 2016, federal loan guarantee subsidies were zero.
Principal contributors: Steve Hanson, Fred Mayes

Follow us on social media: