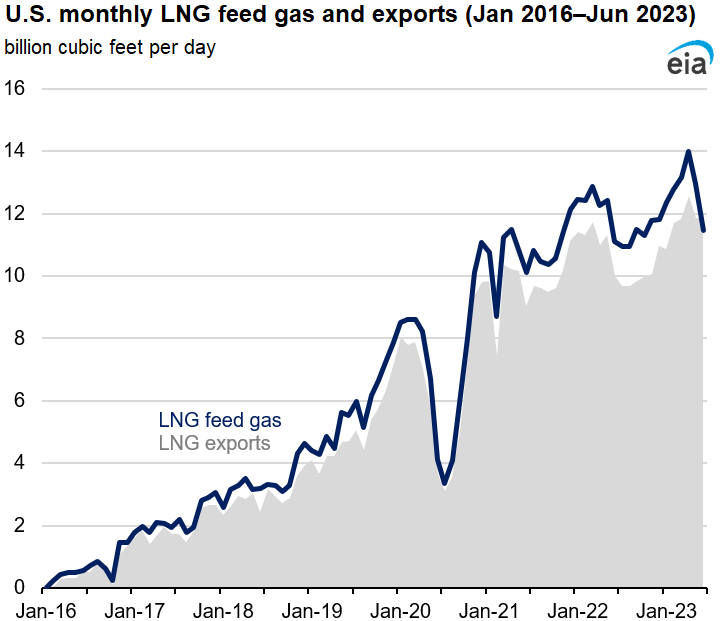


Natural gas deliveries by pipeline to U.S. liquefied natural gas (LNG) export facilities (LNG feed gas) averaged 12.8 billion cubic feet per day (Bcf/d) in the first six months of 2023, following the Freeport LNG terminal’s return to service, according to data by S&P Global Commodity Insights. This average was 1.0 Bcf/d (8%) more than the 2022 annual average and 0.5 Bcf/d (4%) more than the same six-month period in 2022.
LNG feed gas set a monthly record in April 2023 at 14.0 Bcf/d, supported by high international demand for U.S. LNG exports, particularly in Europe. However, LNG feed gas declined in May (13.0 Bcf/d) and June (11.5 Bcf/d), mostly due to maintenance at several U.S. LNG export facilities, including Sabine Pass and Cameron.
LNG feed gas levels are typically higher than LNG export levels because LNG export terminals consume some of the feed gas to operate on-site liquefaction equipment. All U.S. LNG export facilities, except Freeport LNG, have on-site natural gas-fired power plants to generate the electricity required to operate equipment involved in converting natural gas from a gaseous to a liquid state, or LNG.
We estimate that approximately 14% of LNG feed gas is used for liquefaction processes, mostly for on-site power generation. We capture the differences in LNG feed gas and LNG export levels under the Pipeline & Distribution Use category in our Natural Gas Monthly. In addition to LNG feed gas used during the liquefaction process at LNG facilities, the Pipeline & Distribution Use category also includes natural gas consumed in pipeline transportation. In our Short-Term Energy Outlook (STEO), we account for feed gas used in the liquefaction process and natural gas consumed in pipeline transportation in the Natural Gas Pipeline and Distribution Use category in Table 5a. U.S. Natural Gas Supply, Consumption, and Inventories.
Freeport LNG is the only liquefaction facility in the United States and one of only two LNG export facilities in the world that uses electric motors exclusively instead of natural gas turbines to drive the liquefaction compressors. Using electric motors helps the facility comply with the local air emission standards around the Houston area—the location of Freeport LNG. Freeport LNG purchases electricity from the grid to power its liquefaction processes because it does not have an on-site natural gas-fired power plant. As a result, most of Freeport LNG’s feed gas is converted into LNG.
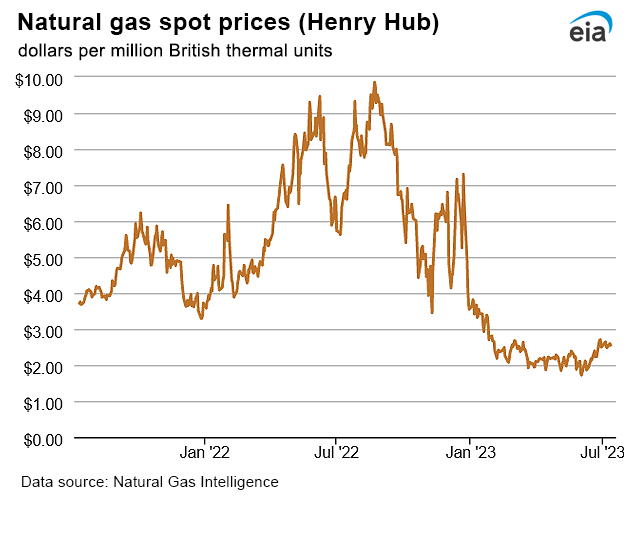
We forecast U.S. LNG exports to average 12.0 Bcf/d in 2023 and 13.3 Bcf/d in 2024, as two new LNG liquefaction projects are expected to come online—Golden Pass and Plaquemines, according to our July 2023 STEO. Global economic conditions and demand for natural gas in Europe and Asia may affect our forecast. Trends supporting higher LNG exports from the United States include assumed continuous replacement of Russia's natural gas exports by pipeline to Europe. Limited growth in global LNG export capacity in the next two years may increase the need for destination-flexible LNG supplies, mainly from the United States. So far this year, mild winter temperatures and above-average storage inventories in the northern hemisphere decreased spot LNG prices, which could be an incentive to import more LNG, particularly in the relatively more price-sensitive countries of Southeast Asia.

Follow us on social media: