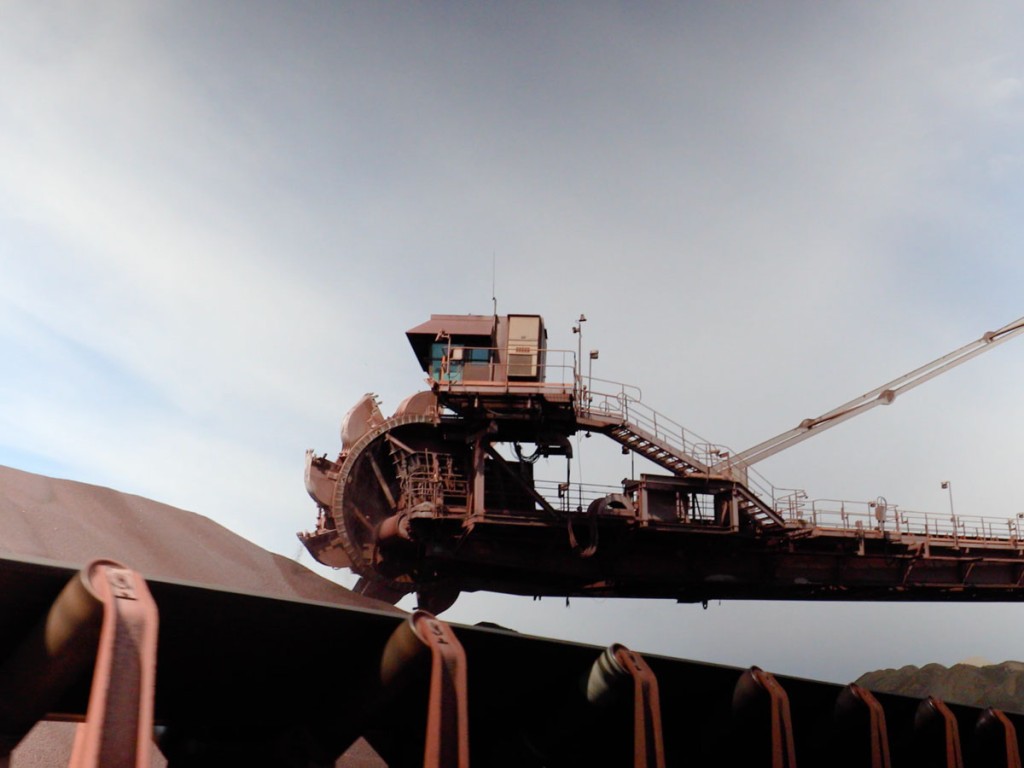
Significant increases in steel, iron, & iron ore tonnage

The Great Lakes Seaway Partnership today reported that American and Canadian ports in the Great Lakes-St. Lawrence Seaway System handled 5,361,000 mt of iron ore (+26.63 percent increase year-over-year) and 1,589,000 mt of iron and steel, an impressive 99.16 percent increase YOY. This noteworthy growth is reinforced by the overall increase in tonnage: 24,163,000 mt metric tons of cargo shipped through the St. Lawrence Seaway (Seaway) from the opening of the Seaway on March 22, 2021, through September 30, 2021 (i.e., Year-to-date or YTD). This is a 2.66 percent increase compared to shipments during the same time period in 2020. Additionally, total transits YTD reached 2,529 vessels, a 2.10 percent increase compared to transits through September last year. Commodities seeing a significant increase include iron ore, steel, as well as cement.
“Vessel traffic through the Great Lakes Seaway System remains steady,” said Craig H. Middlebrook, Deputy Administrator, Great Lakes St. Lawrence Seaway Development Corporation. “Iron ore continues to be a standout export commodity moving through the system, with a 27 percent increase when compared to the same time frame in 2020. General cargo saw a 59 percent increase due to the strong performance of steel products used for manufacturing. While drought conditions in parts of the Midwest continue to affect the export of U.S. grain, we anticipate an increase in grain shipments as the fall harvest becomes available. The Great Lakes Seaway System does not appear to be experiencing the same degree of supply chain disruptions as is the case elsewhere.”
*Combined U.S. and Canadian traffic
**All data is compared year-over-year. Shipments for 2020 from April 1 to September 30, 2020. Shipments for 2021 from March 22 to September 30.
2021 Great Lakes-St. Lawrence Seaway Key Performance Indicators** | |||
|
2020 |
2021 |
Change (+/-) |
Total Transits* |
2,477 |
2,529 |
+2.10% |
Total Cargo* |
23,537,000 mt |
24,163,000 mt |
+2.66% |
*Combined U.S. and Canadian traffic | |||
2021 Great Lakes-St. Lawrence Seaway Key Commodity Trackers*** | |||
|
2020 |
2021 |
Change (+/-)** |
Iron Ore* |
4,234,000 mt |
5,361,000 mt |
+26.63% |
Iron & Steel* |
798,000 mt |
1,589,000 mt |
+99.16% |
Cement & Clinkers |
1,267,000 mt |
1,364,000 mt |
+7.64% |
Coke* |
643,000 mt |
1,062,000 mt |
+65.20%
|
Gypsum |
543,000 mt |
642,000 mt |
+18.27% |
Steel Slabs |
305,000 mt |
464,000 mt |
+51.94%
|
Stone |
190,000 mt |
296,000 mt |
+55.67% |
Potash |
164,000 mt |
279,000 mt |
+69.85% |
Ores & Concentrates |
123,000 mt |
195,000 mt |
+58.15% |
*Combined U.S. and Canadian traffic | |||

Follow us on social media: