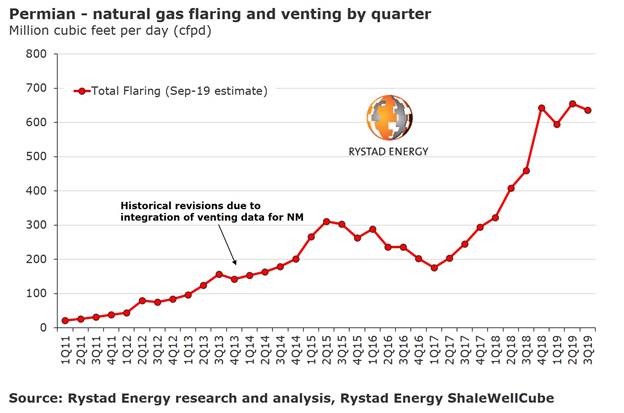
Flaring and venting in the Permian Basin has stabilized in the range of 600 million to 650 million cubic feet per day (MMcfd), according to Rystad Energy’s preliminary data for the third quarter of 2019.
Venting is gas release without combustion, whereas flaring is the burning of excess capacity. In New Mexico, vented and flared gas is reported separately and our research indicates that, on average, 5% to 15% of total flared and vented production stream is vented. In particular, reported data from recent quarters shows a significant decrease in the frequency of venting relative to flaring, with only 8% of waste gas being vented. In the case of Texas, flaring and venting are reported as a lump sum.

The recent launch of the Gulf Coast Express pipeline is set to provide additional takeaway capacity in the fourth quarter of this year, which could alleviate the problem.
“However, it should be noted that the significant number of new well connections in the second half of 2019 might result in a sustained high flaring level, because from an operational perspective, associated gas flaring is normal in the first two weeks following an oil well completion,” says Artem Abramov, head of shale research at Rystad Energy.
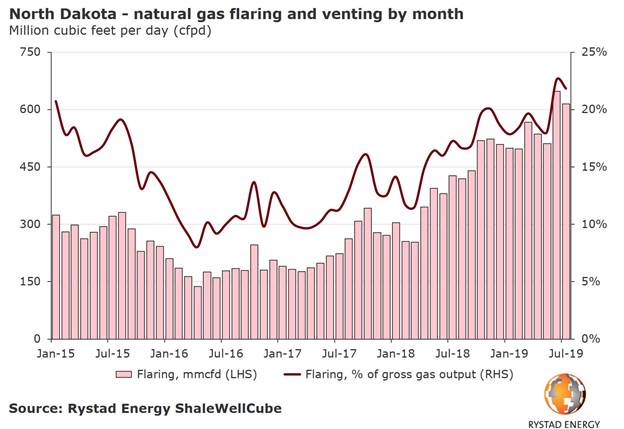
Outside of the Permian Basin, E&P-driven natural gas flaring and venting in the US onshore sector is generally low. The exception to this is the Bakken in North Dakota. As of summer 2019, data from North Dakota shows that 22% to 23% of produced gas was flared – twice as much as the state would like to achieve under the current regulations.
“Such a high level of flaring has never been seen before. The volumes are high not only in absolute terms, but also corresponding to the record high flaring-to-production ratio in recent history,” Abramov noted.
Reported data is now available through July 2019 in both New Mexico and Texas, yet in light of our estimates, we feel the data is largely under-reported. Reported data in New Mexico is close to complete for the first half of 2019, whereas data from Texas still exhibits significant under-reporting for the second quarter and minor under-reporting for the first quarter of the year.

Our model is designed to take the latest reported data into account, as well as the latest activity trends and well productivity metrics, producing the best possible final estimate of total flaring in the Permian for each county and operator. It should be noted that we observe modest downward revisions in our total flaring and venting estimates for both the first and second quarter of 2019, considering the most updated data.

Follow us on social media: