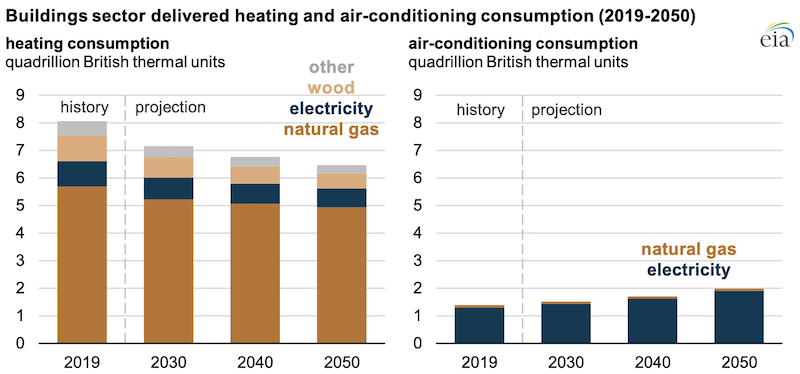
In the Annual Energy Outlook 2020 (AEO2020) Reference case, the U.S. Energy Information Administration (EIA) projects that delivered energy for air conditioning will increase more than any other end use in residential and commercial buildings (also known as the buildings sector) through 2050, while energy consumption for space heating will decline. Higher residential and commercial energy consumption for air conditioning and lower energy consumption for space heating resut from projected population shifts from colder to warmer parts of the United States, assumptions of warmer weather, and regional differences in sector growth.

In 2019, space heating accounted for 38% of delivered energy in buildings, a larger share than any other end use. EIA projects that from 2019 to 2050, delivered energy consumed for space heating will fall by more than 1.5 quadrillion British thermal units—the largest decline among end uses in both absolute terms and percentage terms. Total consumption of delivered energy by the buildings sector will increase by 7% as growing demand for end uses, including air conditioning, electronics, and water heating, more than offsets declines in energy consumption for heating and lighting.
Across the buildings sector, purchased electricity accounted for 94% of delivered energy for air conditioning in 2019. A wider variety of fuels met space heating needs. Natural gas was by far the most common fuel for space heating, accounting for about 70% of energy consumed for space heating in 2019. Smaller shares of wood, distillate, propane, and electricity also fuel heating equipment.

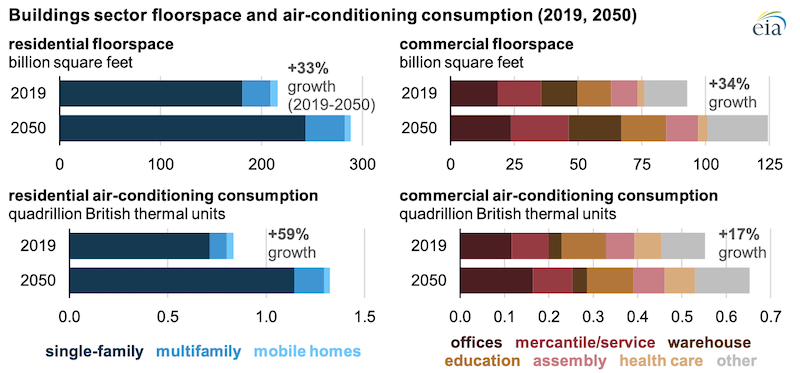
EIA projects that the United States will gain more than 58 million people and 24 million households by 2050 and that total square footage of U.S. residences will expand by 33%. By 2050, 71% of households will be in single-family homes, which typically have more air-conditioned floorspace than multifamily or mobile homes. These single-family homes will consume 86% of the energy used in U.S. residential air conditioning.
In the Reference case, commercial buildings will expand by 34% on a square footage basis. Office buildings consume more energy for air conditioning than any other building type, accounting for 25% of the energy consumed for air conditioning in the U.S. commercial sector in 2050.
Differences between growth in commercial sector floorspace and consumption of energy for air conditioning in the AEO2020 Reference case are caused, in part, by anticipated gains in energy efficiency from appliance standards and building energy codes. Furthermore, the energy intensity of air conditioning varies widely by building type in the commercial sector. Among all building types, warehouses use the least energy per square foot for cooling. Warehouse floorspace expands by 43% from 2019 to 2050, but consumption of energy for air conditioning only increases by 15%.

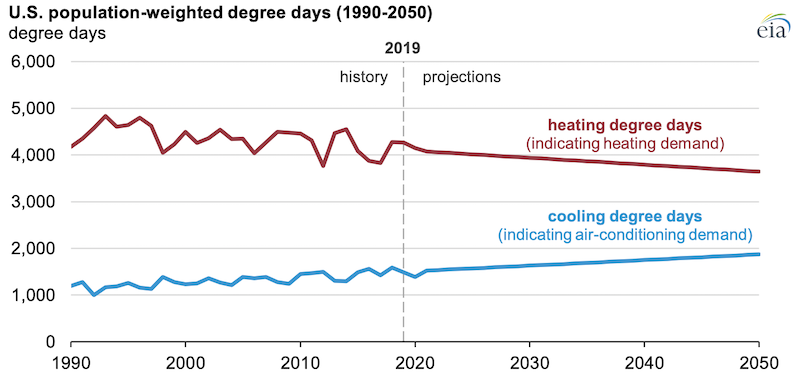
EIA’s model uses population-weighted degree days as indicators of heating and cooling demand. Annual heating degree days measure how often and how far temperatures fall below 65 degrees Fahrenheit, indicating demand for indoor heat. Heating degree days have generally declined as temperatures have risen and as the U.S. population has moved to warmer climates. Conversely, cooling degree days (indicating days when average temperatures in a location exceed 65 degrees Fahrenheit) have generally increased.
Based on population-weighted heating and cooling degree day data from the National Oceanic and Atmospheric Administration and U.S. Census Bureau population data, EIA estimates that in 2019, the United States experienced almost 4,300 weighted heating degree days and nearly 1,500 cooling degree days. The difference between these values largely explains why more energy is used for space heating than for air conditioning. EIA expects historical trends in population growth, regional population distribution, and average annual temperature to continue through 2050, and it expects the difference between population-weighted heating and cooling degree days to continue to narrow.

EIA’s long-term building sector models rely on EIA’s surveys of residential and commercial buildings. The residential model uses the Residential Energy Consumption Survey (RECS) to estimate the initial stock of single-family, multifamily, and mobile homes, as well as equipment and appliance stock and several usage indicators. The commercial sector model uses information from EIA’s Commercial Buildings Energy Consumption Survey (CBECS) to estimate commercial floorspace by building type and several energy intensity metrics. More information about EIA’s long-term projections of the buildings sectors is available in the AEO2020 presentation and assumptions report.
Principal contributor: Courtney Sourmehi

Follow us on social media: